Thank God that 2020 is over.
Nevertheless, here is my monthly report on where we are, and where we are going.
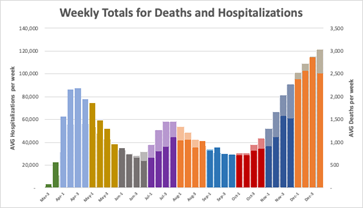
The graph below is updated now to include December. As everyone will have suspected, the weekly death tolls have been rising since the beginning of the month.
We are now 4-5 weeks past Thanksgiving, and we are seeing the consequences of the travel and gatherings of that period. Deaths are at a level higher than any time since March and hospitalizations, which are increasing at comparable rates to deaths are also at their highest rates.
Unfortunately, we are likely to experience even higher numbers as the “Thanksgiving Surge” begins to taper off in the next few weeks, to be supplanted by the “Xmas/New Year’s Surge” that will begin near the end of January and into February.
Vaccinations will begin to have an effect, but not for several months.
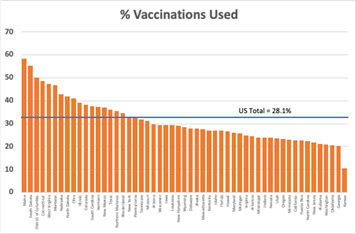
The most troubling news on the vaccine front is the rate of inoculations as a percentage of doses shipped. This can be seen in the second graph. Here I have plotted the % of doses given to people compared to the doses shipped for each state in the country.
For the country as a whole, we have seen that about 28% of those doses have actually found their way into arms.
The states that have been most effective, although they still have less than 60% of those doses delivered include:
Maine
South Dakota
District of Columbia
Connecticut
The states that have been least effective in distributing their allotted vaccines (less than around 20%) include:
Kansas
Georgia
Oklahoma
Washington