
While out hunting a Chemist misses the deer 5 feet left, the Physicist misses it 5 feet right. The Statistician says, “Got it.”
Please excuse this essay, it’s pretty wonky.
We have now reached a point of relative equilibrium with COVID. While we still are suffering a little over 200 deaths per day across the country, this is down almost 50% over the past two months and is probably representative of what we can expect to continue to see through the next year or so. These numbers are tragic for the families involved, but not a cause for national concern or actions. About 50% of those deaths occur among the non-vaccinated.
I have thought that this is a good time for us to reflect on the pandemic, how it spread and who succeeded and/or failed in response to it.
As we move into the next election season, we need to understand the data rather than the rhetoric. For example, I have recently heard people praise the response that Governor DeSantis made to COVID-19. Unfortunately, the data do not support that praise.
Florida ranked as the 7th highest state in the nation regarding Cases per million population, almost 13% above the national average.
Florida ranked as the 12th highest state in the nation regarding Deaths per million population, 22% above the national average.
Florida was a little better in treating cases, but still fell short. Florida ranked as the 21st highest in deaths per case per million population, still 8% over the national average.
The 83,000 people who died in Florida represent about 12,000 more deaths than what would have been expected from the national averages. This is not a result for which someone should be proud.
Where did these numbers come from?
I have quantified the spread of COVID-19 through the population in each state in the country as well as the death rate in each of those states.
In order to look at these numbers it is best to express the data in relation to the population of each particular state. Clearly the states with the largest population will have had the largest number of cases and the largest number of deaths, but to look at how the citizens’ response in each state affected those numbers, you need to look at those numbers in relation to that state’s population. So, the data is best viewed as “____ per million population in that state.”
There are three charts below to help look at this data.
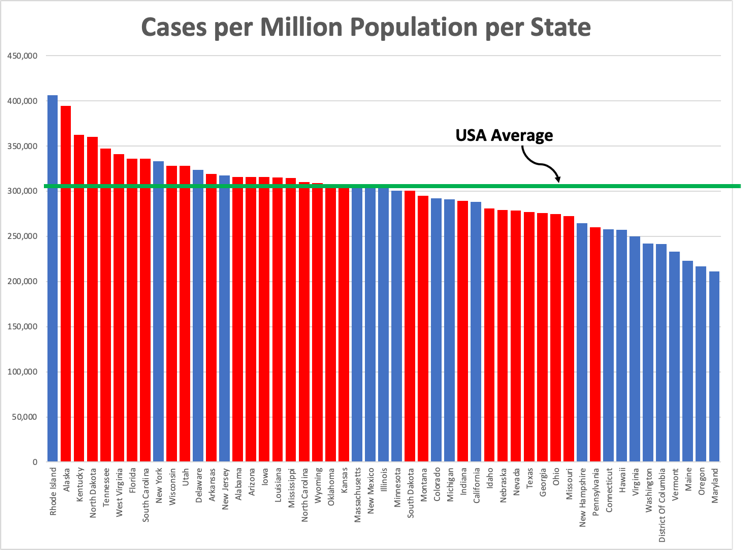
The first shows the data for the number of cases in each state. The Average number of cases per million population in the US was just over 300,000, which correlates to 30% of the population having contracted COVID-19.
I have shaded the bars in each state by their votes in the 2016 Presidential election. This displays how those states that supported the elected administration, and who could be expected to have followed the advice and direction of their selected and incoming administration experienced the virus as opposed to those states that took their information from the other side.
We see from the distribution that cases were higher, in general, within the Red states than within the Blue states.
- Within the 10 states with the HIGHEST number of cases per million population of that state, 8 voted for the Republican candidate, 2 voted for the Democratic candidate.
- Among ALL states with a case rate HIGHER than the national average, 19 out of the 23 states voted for the Republican candidate (only 4 voted Democratic)
- Within the 10 states with the LOWEST number of cases per million population of that state, 1 voted for the Republican candidate, 9 voted for the Democratic candidate. Interestingly, the only Red state in that group was Pennsylvania, a state with a strong Democratic historical voting record.
- Among ALL states with a case rate LOWER than the national average, 11 out of the 28 (includes DC) voted for the Republican candidate (17 voted Democratic).
It is clear that those states that followed the Republican Party advice experienced a significantly higher level of infection than those that followed the Democratic Party advice.
This is extremely important as we now understand that infections, even with recovery sans vaccination can lead to long-Covid and/or health consequences down the road with heart disease and brain damage.
Now, how does that data translate into mortality?
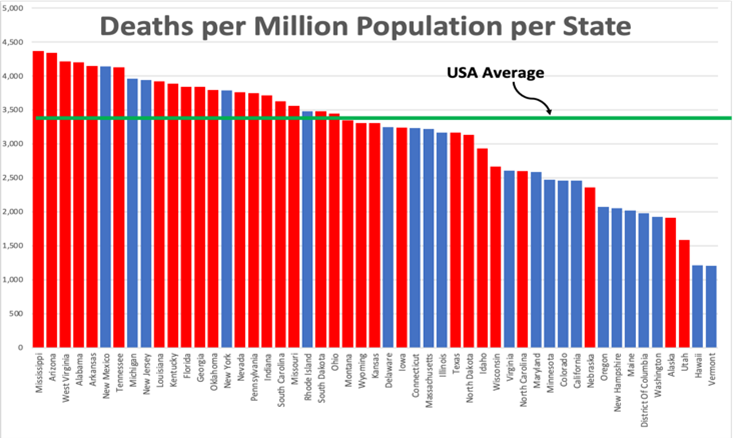
The data can be seen in the second graph.
Using the same analysis as above we can see:
- It is clear from the distribution that deaths were higher, in general, within the Red states than within the Blue states.
- Within the 10 states with the HIGHEST number of deaths per million population of that state, 7 voted for the Republican candidate, 3 voted for the Democratic candidate.
- Among ALL states with a death rate HIGHER than the national average, 17 out of the 21 states voted for the Republican candidate (only 4 voted Democratic)
- Within the 10 states with the LOWEST number of deaths per million population of that state, 3 voted for the Republican candidate, 7 voted for the Democratic candidate.
- Among ALL states with a death rate LOWER than the national average, 12 out of the 30 (includes DC) voted for the Republican candidate (18 voted Democratic).
- The death rate in Red states was 20% higher than that in Blue states.
It is clear that those states that followed the Republican Party advice experienced a significantly higher level of death than those that followed the Democratic Party advice.
Finally, I looked at the risk of death in each state by comparing the case rate to the death rate. The higher the percentage of people dying from COVID-19 compared to the rate of cases in that state, the more severe the infection is in that state.
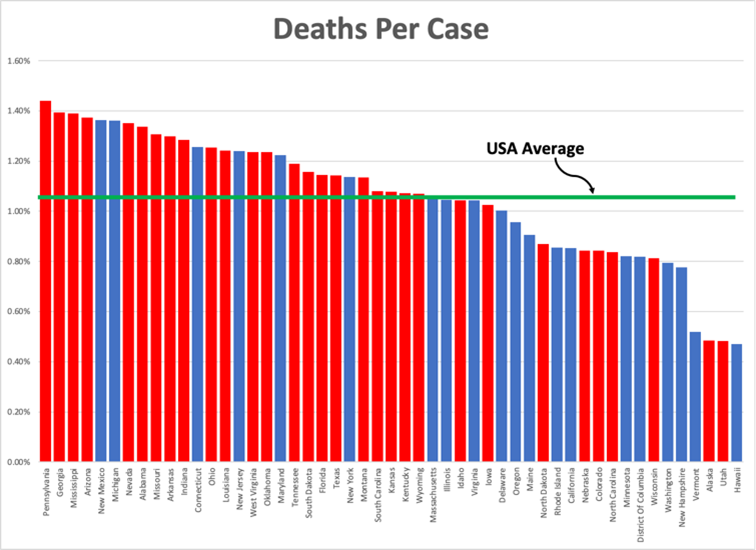
Once again, the distribution is clearly skewed towards the Red states.
- Within the 10 states with the HIGHEST percent of deaths per cases in that state, 8 voted for the Republican candidate, 2 voted for the Democratic candidate.
- Among ALL states with a death rate HIGHER than the national average, 16 out of the 22 states voted for the Republican candidate (only 6 voted Democratic)
- Within the 10 states with the LOWEST number of deaths per million population of that state, 4 voted for the Republican candidate, 6 voted for the Democratic candidate.
- Among ALL states with a death rate LOWER than the national average, 15 out of the 29 (includes DC) voted for the Republican candidate (14 voted Democratic).
It is now evident, all though it may have been intuitive, that those states that followed the Republican advice on COVID-19, particularly over the first 18 months, suffered more greatly than those who followed the Democrats advice.
On average the Blue states were 7% below the national average in cases per million, and 12% below the national average in deaths per million, while the Red states were 5% above the national average in cases and 8% above the average in deaths.