There is probably little surprising in the data from November. The news has been full of stories of increasing infections, increasing deaths and increasing hospitalizations. The data confirms these stories.
There is also tremendous good news on the vaccine front. We can expect that the BioNTech vaccine distributed by Pfizer, as well as the vaccine from Moderna will be approved for emergency use within the next 2 weeks. The FDA and CDC can be expected to go through normal approval processes, accelerated as much as possible, but staying within guidelines. This will be followed in the next month by approvals for AZ and Oxford vaccines followed by Novavax, J&J and Sanofi. All will find appropriate niches for distribution and use. In this particular pandemic, and because of the specific issues it is likely (and supportable) that the emergency use authorization will be extended well beyond its usual restricted scope to be used widely. Continued monitoring of safety/efficacy data will be used on a rolling basis to provide a better understanding of the use of individual vaccines for all age groups.
As vaccines become distributed and more and more people get immunized we will be able to see a reopening of society (it is more than just the reopening of the economy, but the reopening of your willingness to have guests in your house, to visit friends and relatives and to congregate in public spaces, houses of worship and sporting venues, to participate in group activities like exercise, ball games and parades.).
Now for the troubling state we are in today.
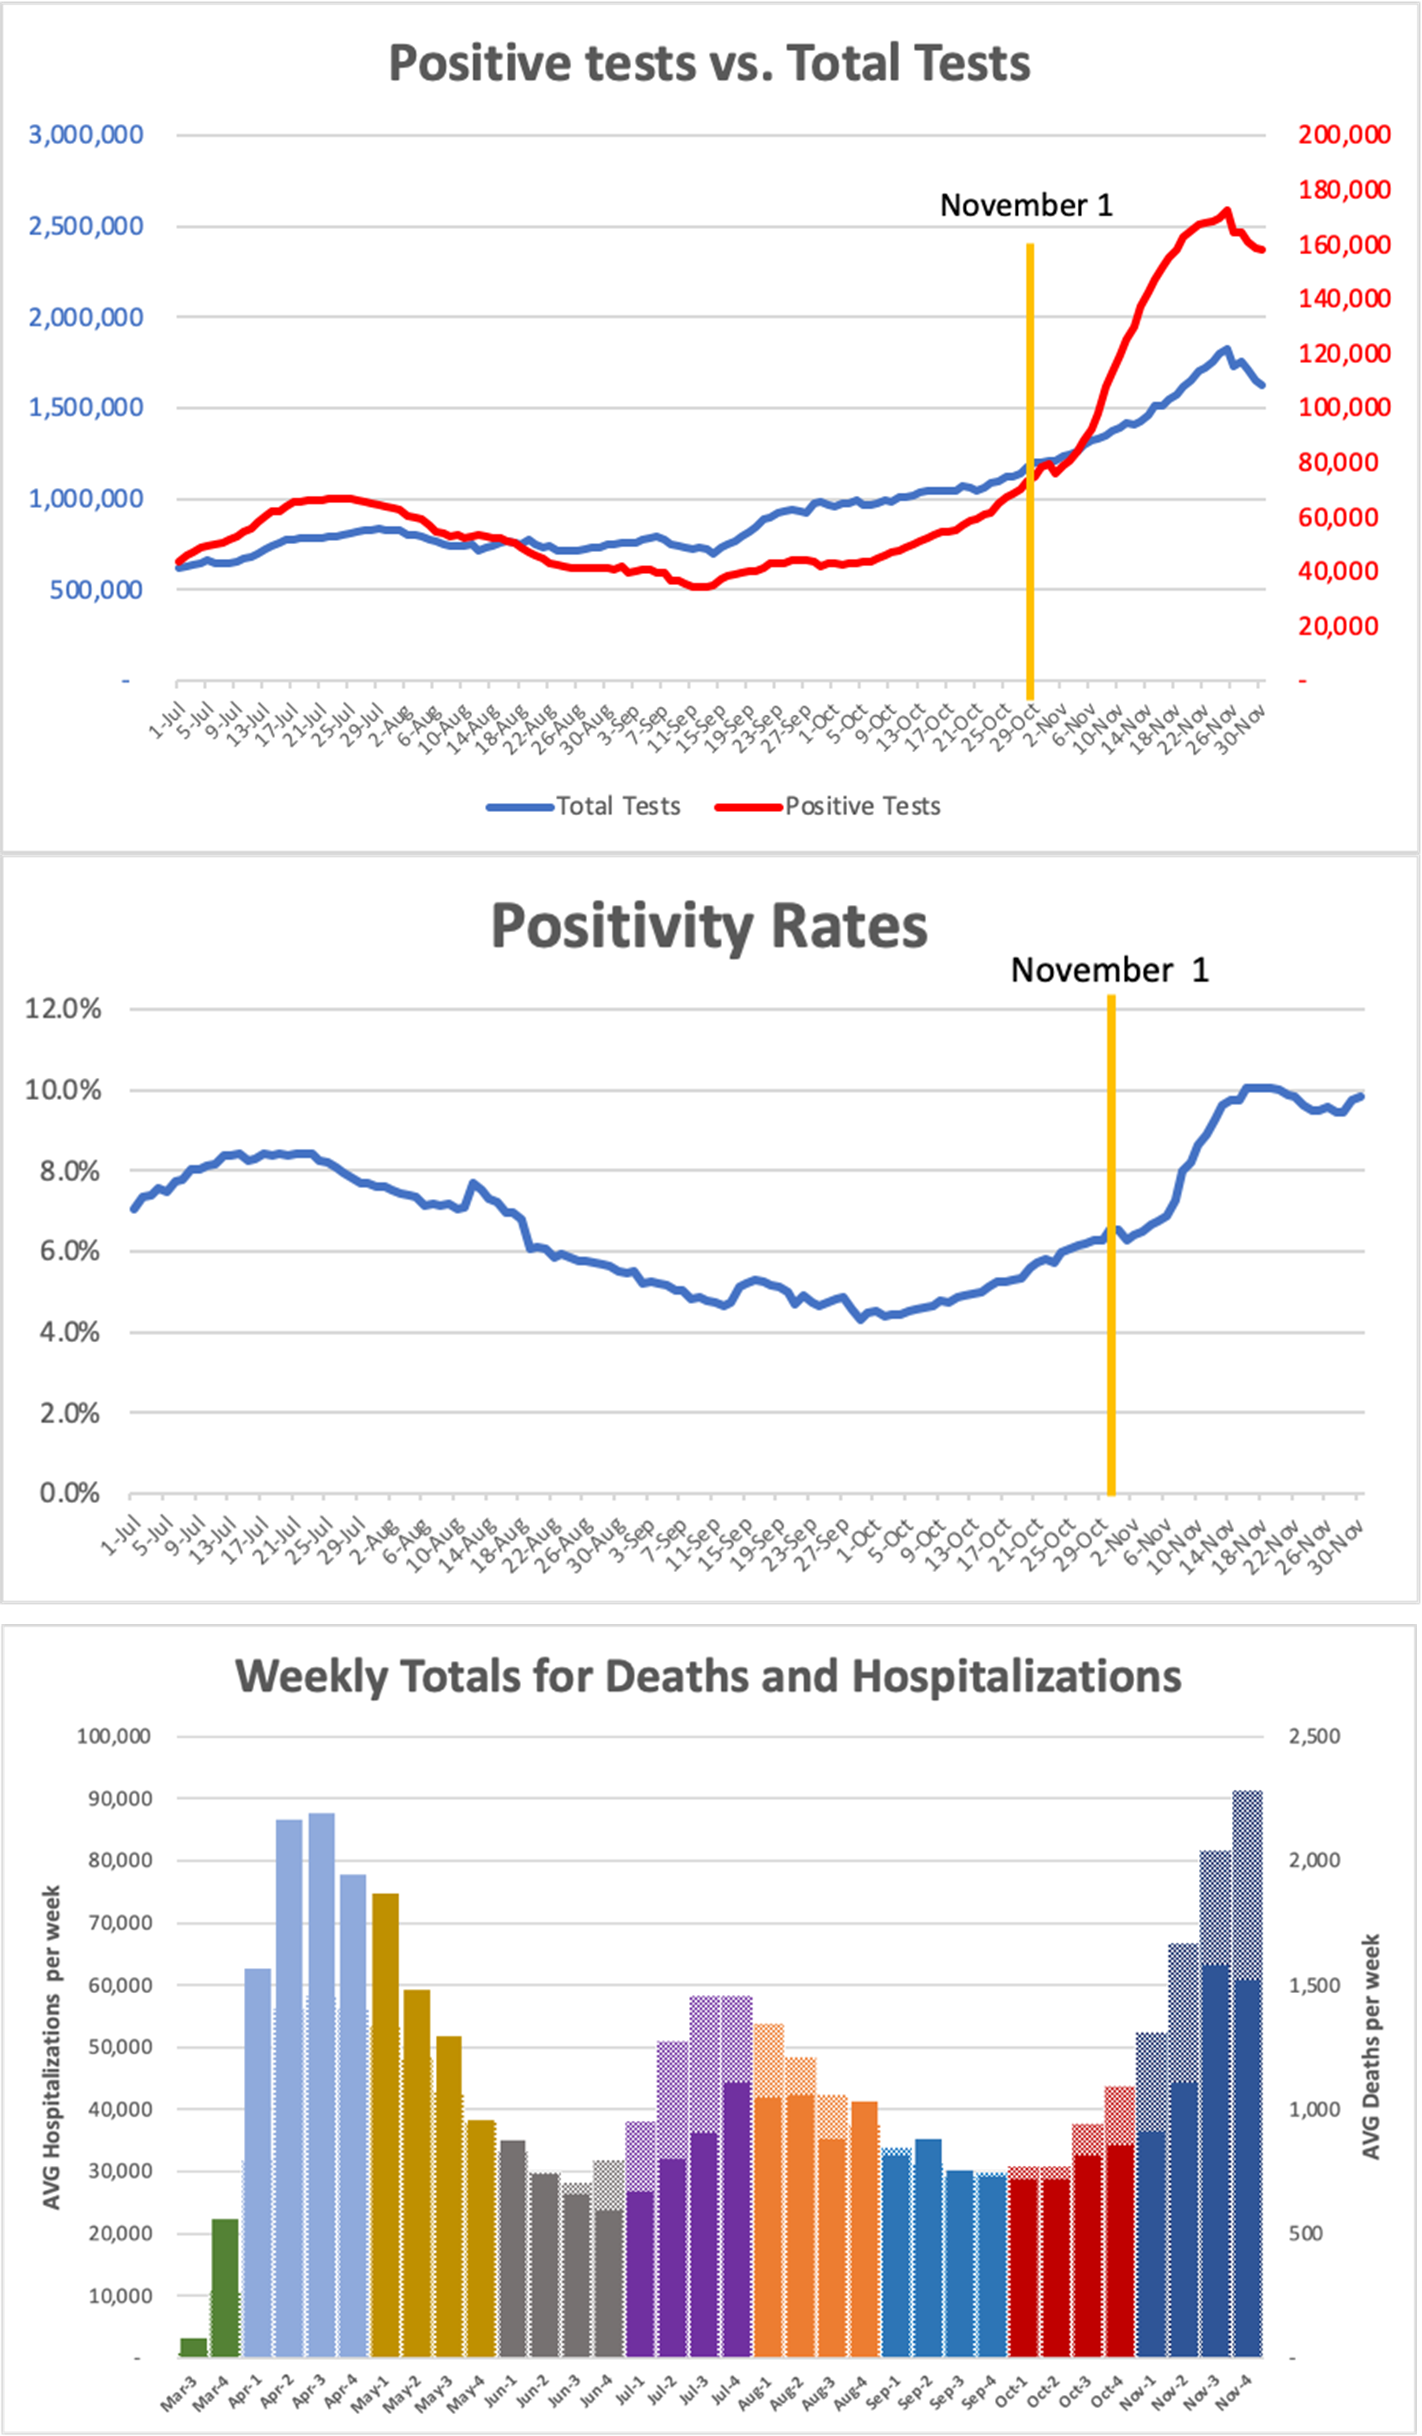
In October we began to see an increase in positivity, and that increase has accelerated. In the attached graphs you can see two clear trends. The number of positive cases identified in relation to the number of tests performed has continued to increase. This means that even with increased testing and the concurrent identification of new cases, the numbers of new cases identified is higher than the increase in testing. The conclusion is that the rate of infection in the general public is increasing rapidly across the country.
A short note about testing. By now everyone should understand that testing is a snapshot of where any individual is at the time of testing. It does not reflect whether you had been infected a month earlier and recovered, even if you were not aware of it (that is determined by an antibody test). In that case you would test negative as would someone who had not been infected before. Also, it takes between 4 and 7 days after you become infected before you may shed virus and therefore test positive. So, people who test negative may, in fact, be infected but not yet showing. That is why the CDC recommends that if you were in close contact with an individual who tests positive, that you quarantine for 10 days if you don’t get tested, or for 5 days if you test negative.
The main benefit of increased testing is to be able to monitor the population to determine where infections are increasing and to then impose healthcare procedures to limit spread. This should be a universally accepted principle; from the left it is a matter of societal responsibility to the whole, from the right is a matter of personal responsibility to the individual. Either way, it is critical that you act in a manner that will protect others from you.
The second graph affirms the increasing total positive tests by looking at the Positivity Rate, which is also increasing at a more and more rapid pace each month since September.
The final graph shows the deaths per week that we have been following. In September we were hopeful that the trend was towards lower deaths per week and we discussed whether that might be due to increased ability to treat disease. In October those decreases began to appear to reverse. That reversal now is complete in November. The deaths per week is increasing and early December data is confirming that the rate of deaths in the country continues to increase.
I have superimposed on this graph the hospitalization data which shows that increasing deaths is being paralleled by increasing hospitalizations.
The trends are clear. We can expect that over the next 7 weeks, prior to January 20, within the rules and practices of the current administration, that we can expect to see between 2,000 and 3,000 deaths per day. Over the 50 days left in this period we can thus expect to see between 100,000 and 150,000 new deaths, taking our total deaths in the 10 months since the first death from COVID-19 in this country to between 370,000 and 420,000 deaths by January 20, which would amount to a yearly death rate from COVID-19 in this country to about 450,000 to 500,000.
The charge on the incoming administration will be to reverse those trends or we will reach a million deaths sometime by the end of the 2021.